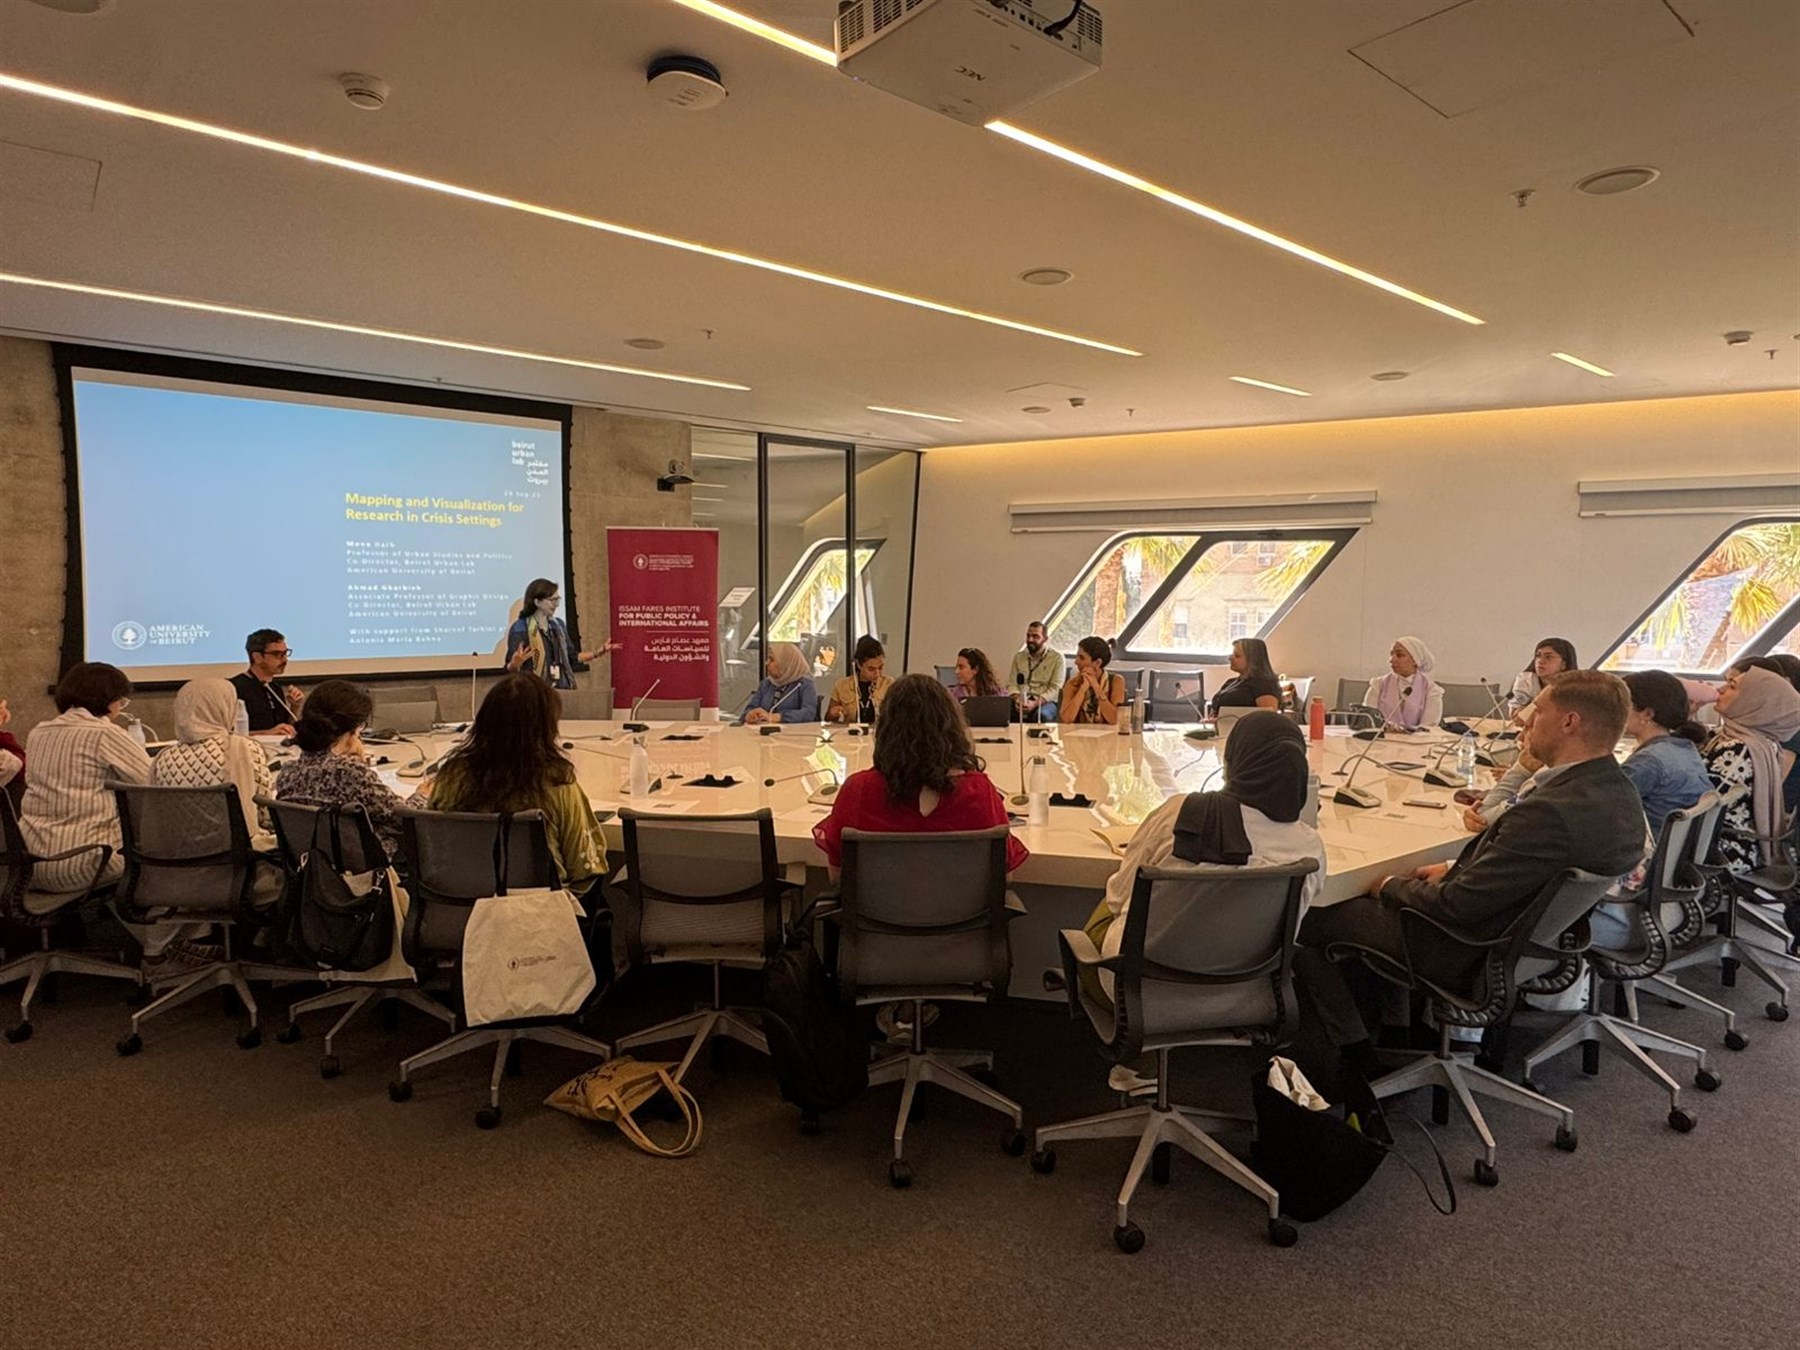
“Mapping and Visualization for Research in Crisis Settings” Workshop
About the Workshop
The workshop introduced participants to methodologies of mapping and visualization, drawing on the Beirut Urban Lab’s extensive experience with ArcGIS platforms. It highlighted the approaches BUL uses for geo-referencing data, as well as the diverse methods it applies for data collection, analysis, and visualization.
Key projects were presented to illustrate these practices, including maps and visualizations of the 2023–2025 Israeli war, the Port Blast response, Beirut’s urban transformations, and the 2020 Covid-19 response. Some projects were examined in greater depth to demonstrate the full workflow, from gathering data to producing visual outputs.
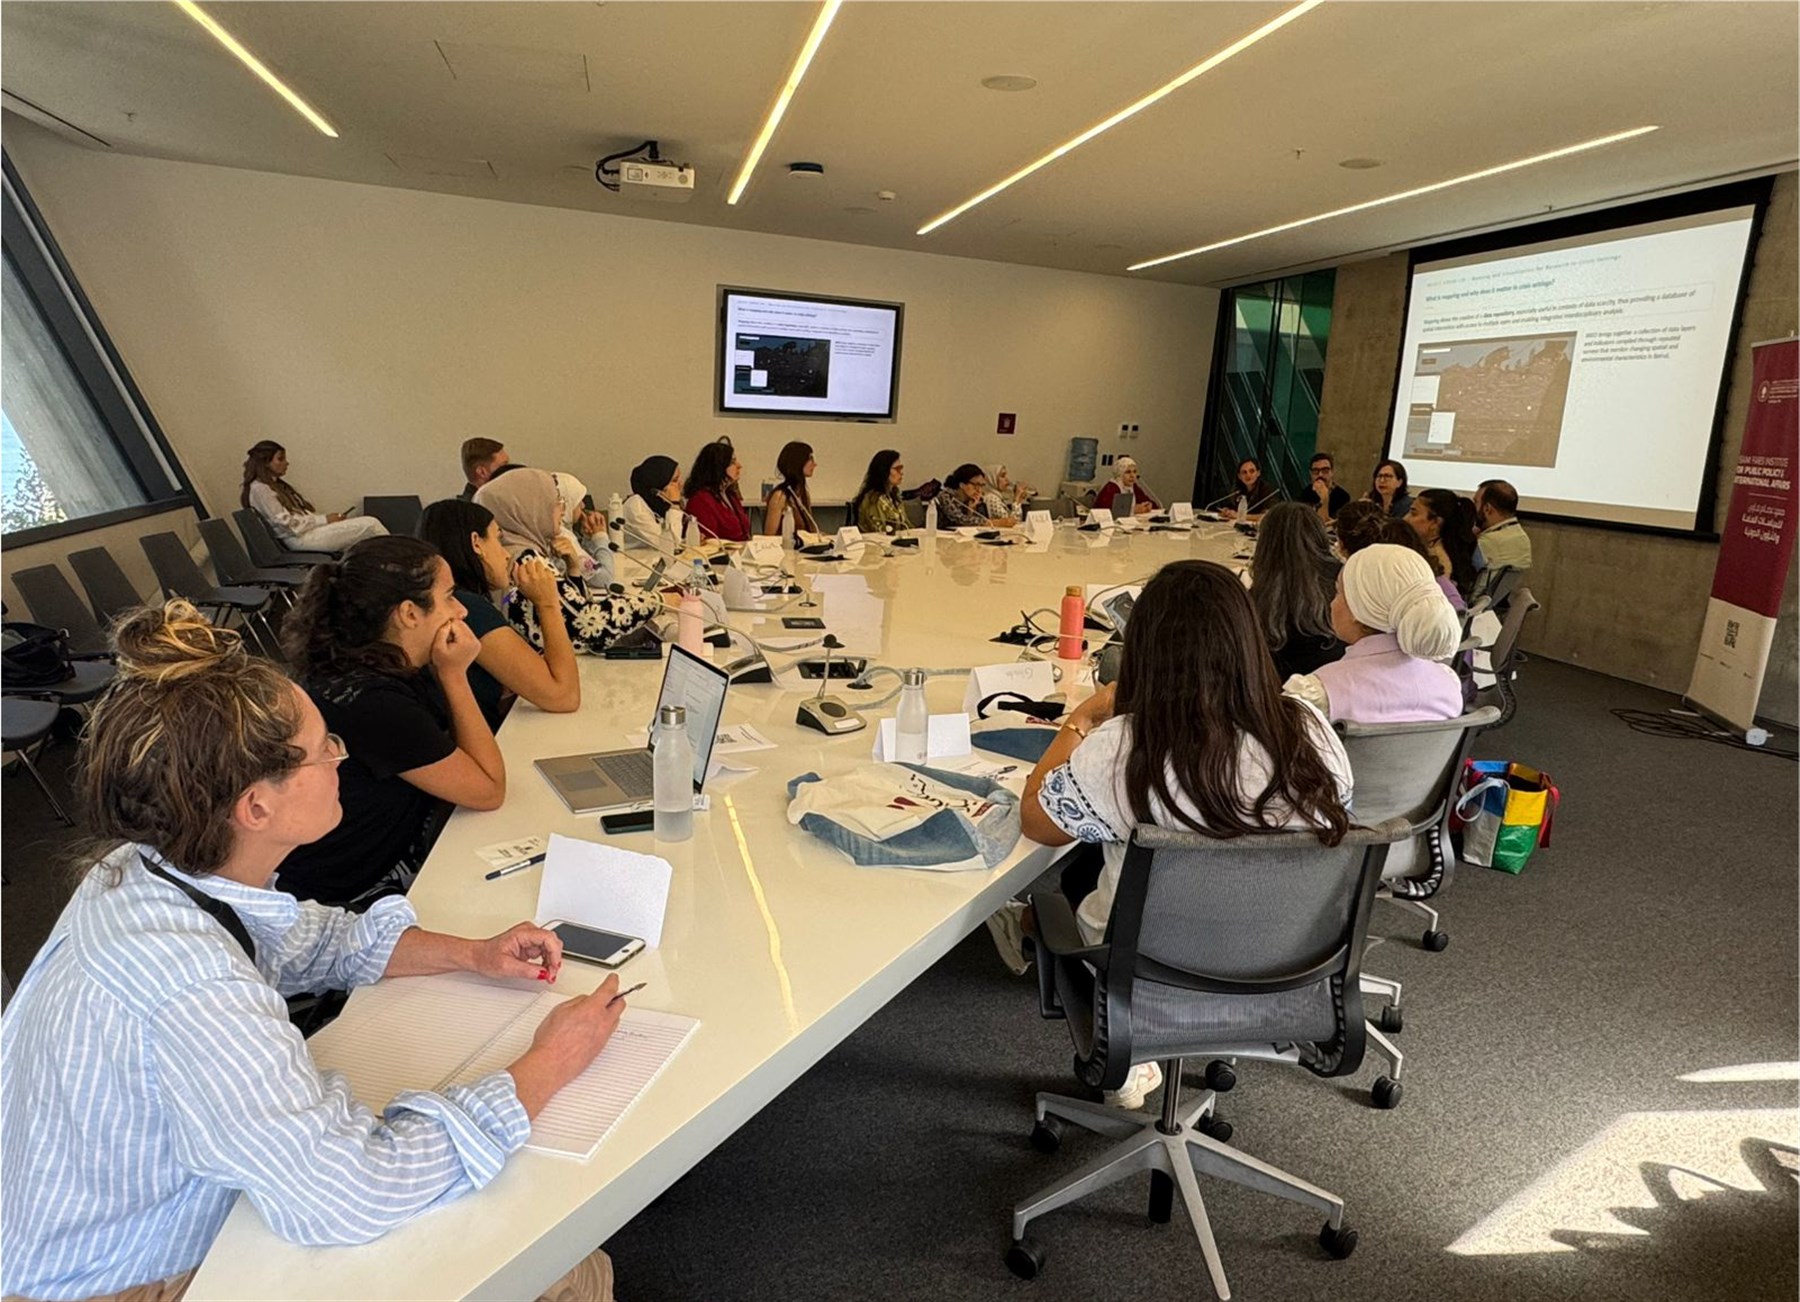
By combining presentations, software demonstrations, and hands-on exercises, the workshop gave participants direct insight into BUL’s processes and showed how mapping can inform and enhance research in crisis settings.

Workshop Program
The workshop unfolded over a half-day session that included the following three main sections:
• Understanding Maps, Spatial and Visual Thinking introduced the conceptual foundations of mapping, highlighting how maps function not merely as technical products but as tools that shape the way data is conceived and represented.
• A Guide to Data Sources and Types examined the range of data that BUL works with, including crowdsourced information, archival materials, satellite imagery, and media monitoring.
• Mapping Research Workflow: From Data to Visualization walked participants through BUL’s process for collecting, cleaning, analyzing, and visualizing data using ArcGIS Pro, culminating in a live demo that illustrated these different steps.
The workshop closed with an open exchange and discussion, during which participants shared their questions on mapping and visualization in relation to their own research needs.
The Beirut Urban Lab is planning to host further mapping and visualization workshops in the future, which will be announced through BUL social media.