Tracking the Urbicide in Gaza
The Context
Urbicide, as argued by Martin Cowardi, encompasses not only the physical destruction of buildings and infrastructure but also the resulting disruption of social and cultural networks, the displacement of populations, and the erasure of collective memory. The urban in this project is therefore understood as an all-encompassing, multilayered, and connected construct. In the case of Gaza, violence against the built environment is not a by-product of military action, rather urbicide manifests as a deliberate strategy employed by Israel to undermine the livelihood, the development, and the culture of the Palestinian people.
Gaza is a constructed "strip" that has been built since 1948 as an "exceptional" Palestinian territory which was controlled by the Egyptians and then the Israelis. The "strip" has merged historical cities with camps and agricultural lands around them into a spatial enclave where Israelis have confined many Palestinians. The densely populated urban environment of Gaza, including major cities and eight refugee camps, the largest of which is Jabalia, becomes both a battleground and a target where civilian infrastructure and residential neighborhoods bear the brunt of violence. However, the unfolding urbicide in Gaza is not an isolated event that commenced on October 7th. It is a severe eruption in the context of an unrelenting history of violence that has subjected Gaza to military occupation, blockade, siege, and repeated episodes of military rampage each of which has sought to squeeze life out of its civilian populations.
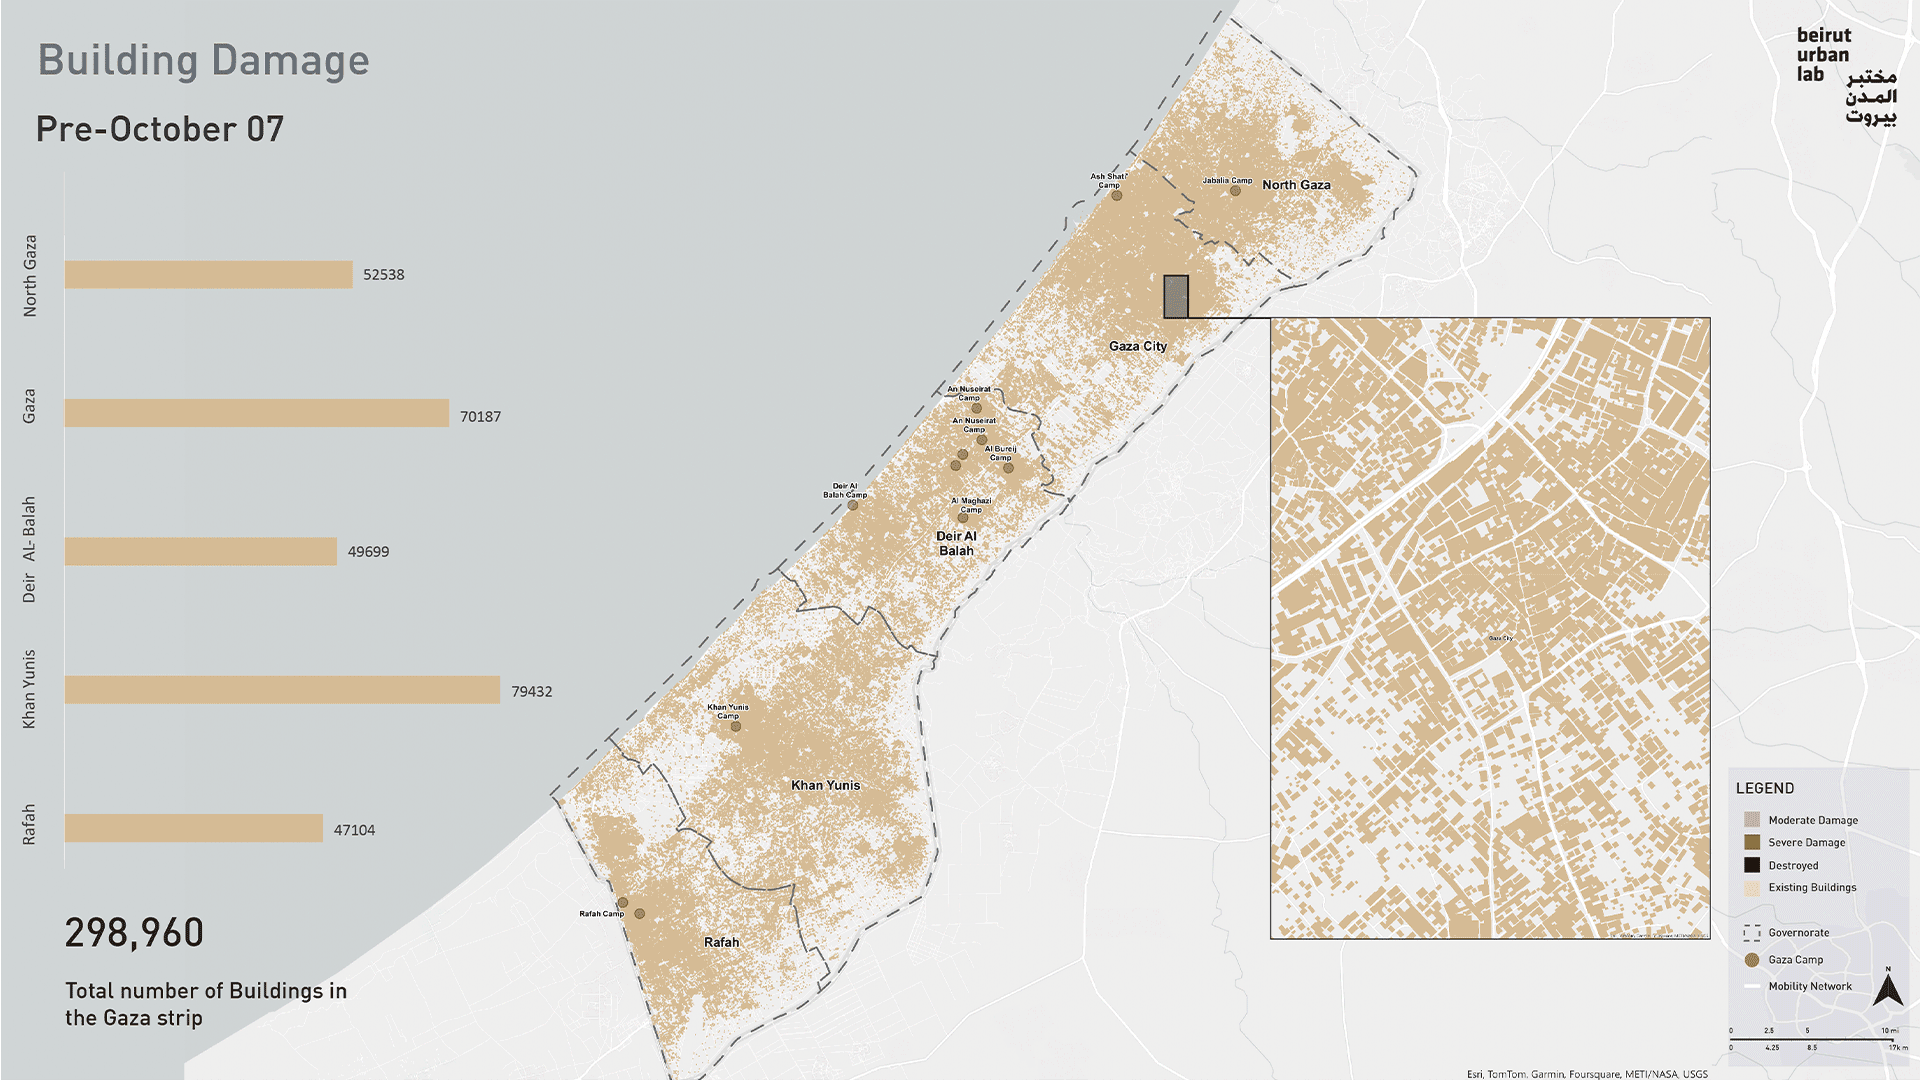
Over the past six months, the densely populated Gaza, which stretches over 365 km2 with a population of 2.3 million, witnessed devastating military operations, leaving entire neighborhoods reduced to rubble and countless lives shattered. From airstrikes targeting residential buildings to artillery shelling tearing through streets, the urbicide in Gaza has inflicted immense suffering, exacerbated humanitarian crises, and displaced hundreds of thousands of families. At least 34,305 people have been killedii, and nearly all of the population has been displacediii. By February 29, 27.4% of total structures in the Gaza strip were damaged with 27,157 structures destroyed, 15,714 severely damaged, and 38,779 moderately damaged.
Those numbers show a massive increase in the total number of structures destroyed or severely damaged (48,106) compared to that in the sum of all four Israeli military operations between 2008 and 2021 (10,326)iv, knowing that each of the previous campaigns was already globally denounced for the severity of the damage it inflicted on people and buildings. Gaza has thus been subjected to exceptionally violent and deadly assaults by the Israeli military. The campaign has systematically destroyed critical infrastructure such as schools, hospitals, archaeological sites to state archives, and even greenhouses. It has unmistakably embarked on a campaign of urbicide, a planned act of erasure and assault on the urban environment and all that it embodies: a sense of collective identity, community, and culture.
Dr. Awni Etaywe, of Charles Darwin University, has referred to Israel’s military offensive in Gaza as an act of 'geno-urbicide', which involves both systematic genocidal acts and the intentional destruction of cities, resulting in significant loss of life and the devastation of urban landscapesv.
The Content
This platform is work in progress which the Gaza Working Group at the Beirut Urban Lab aims to build on. The intention is to go beyond the tracking of destruction of the built environment to the tracking of displacement and the analysis of long-term impacts on recovery.
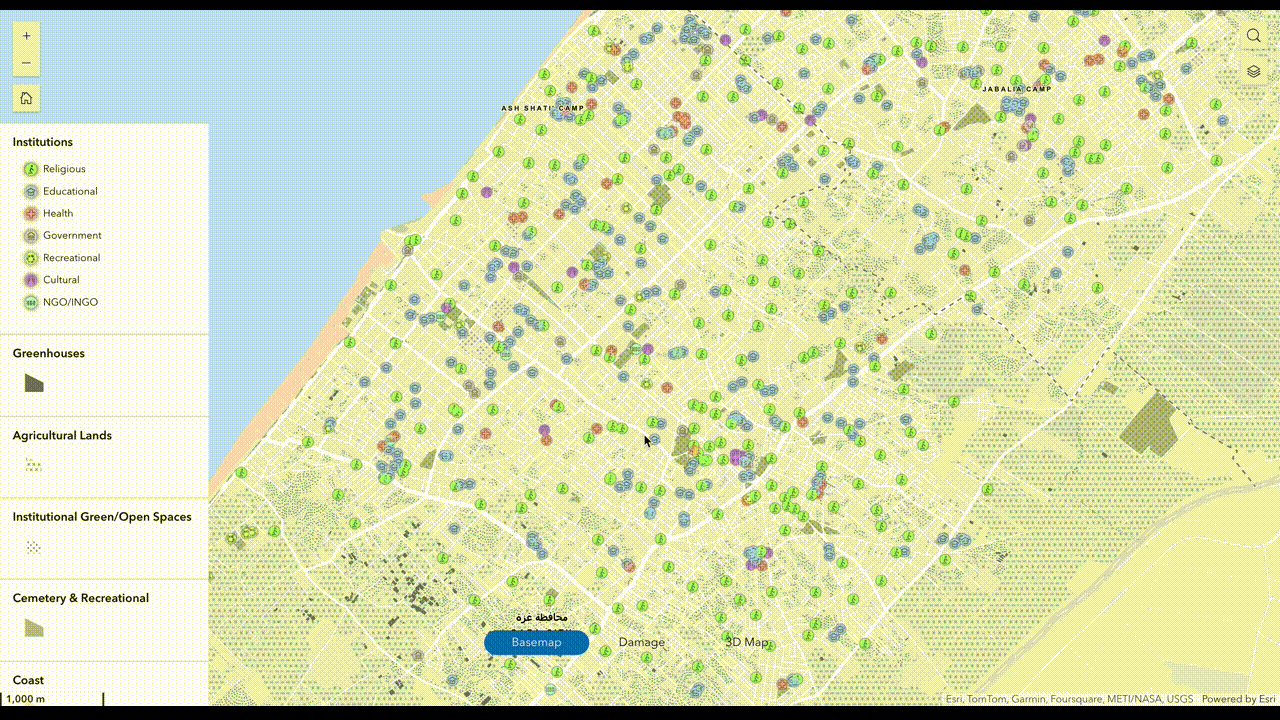
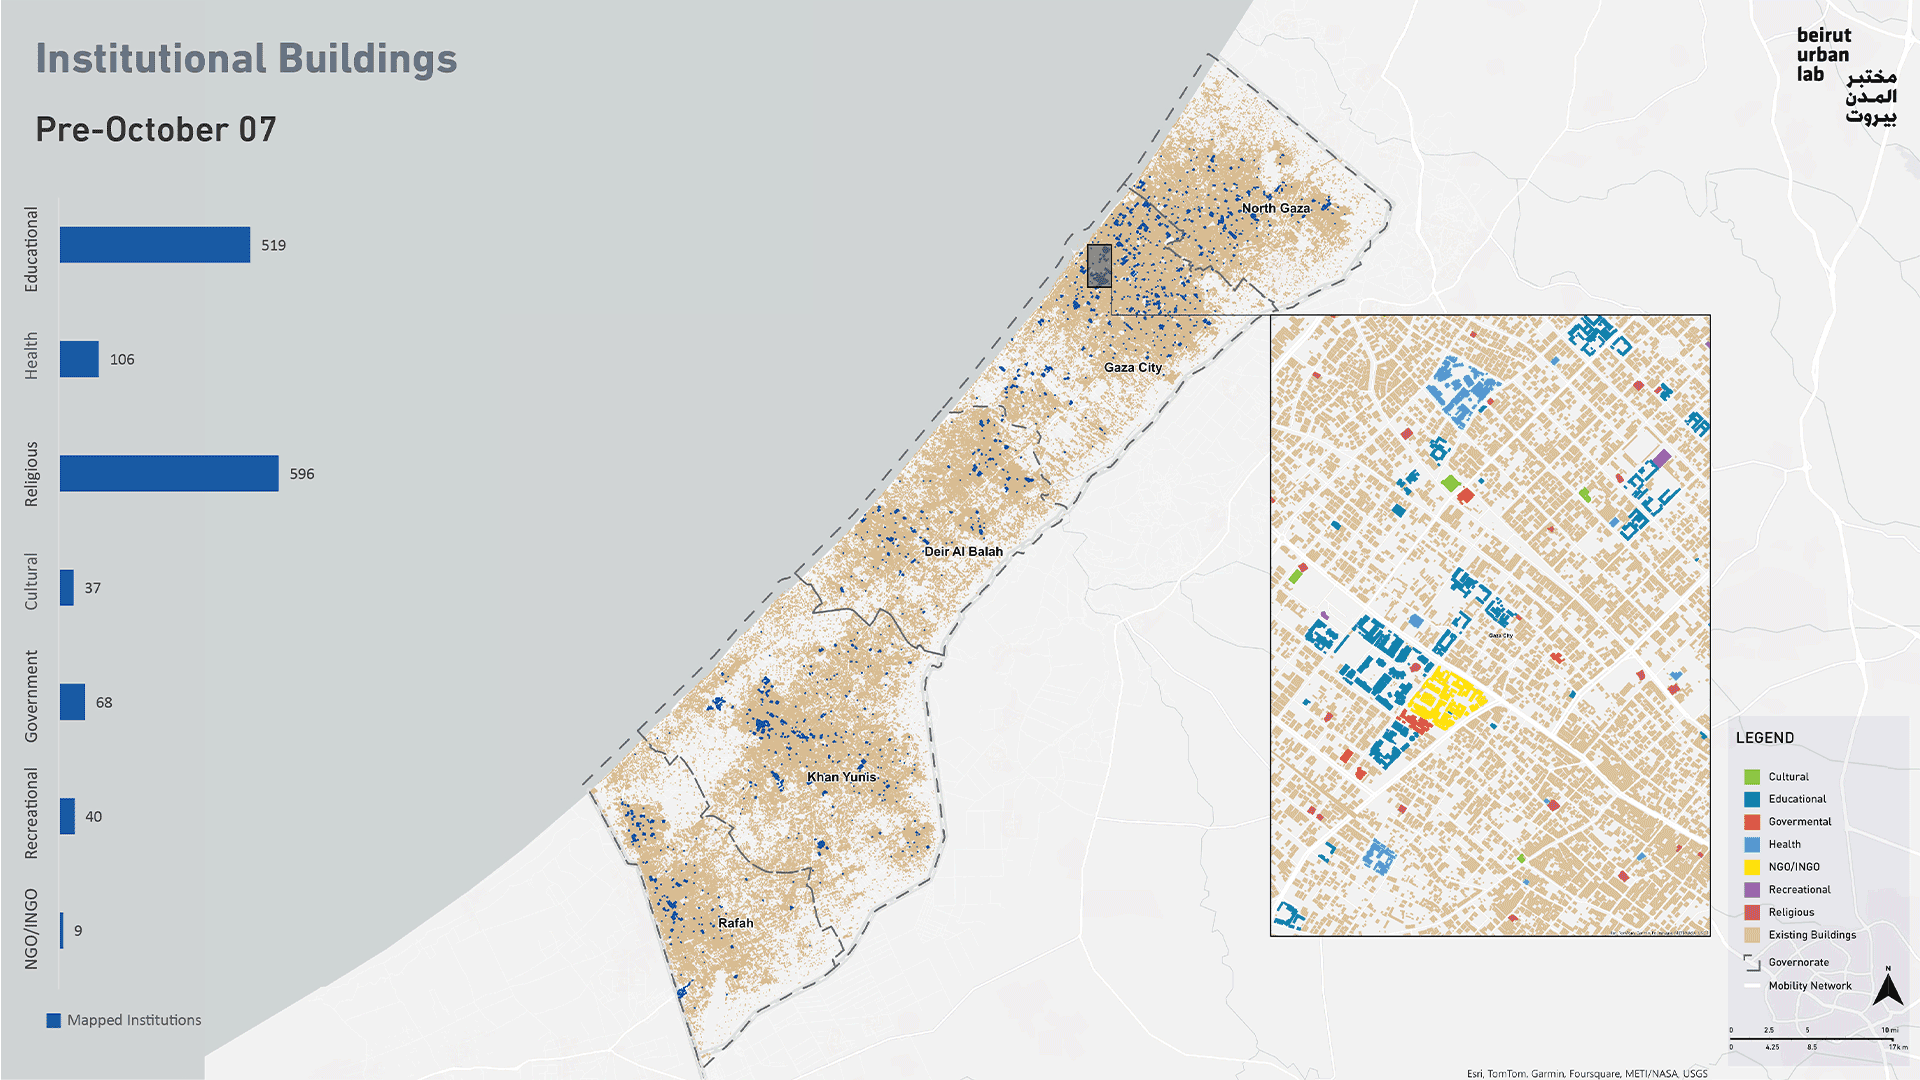
At the moment, it is a mapping project that tracks urbicide and documents damage to different layers of the built environment including: buildings, green/open spaces, institutions such as universities, schools, hospitals, governmental buildings, as well as agricultural lands and infrastructure. The tracking documents damage at different moments in time from October 7th onwards with short intervals. The mapping intends to serve as an archival record of the massive violence inflicted on the cultural, educational, infrastructural and environmental constitution of Gaza.
Methodology and Significance
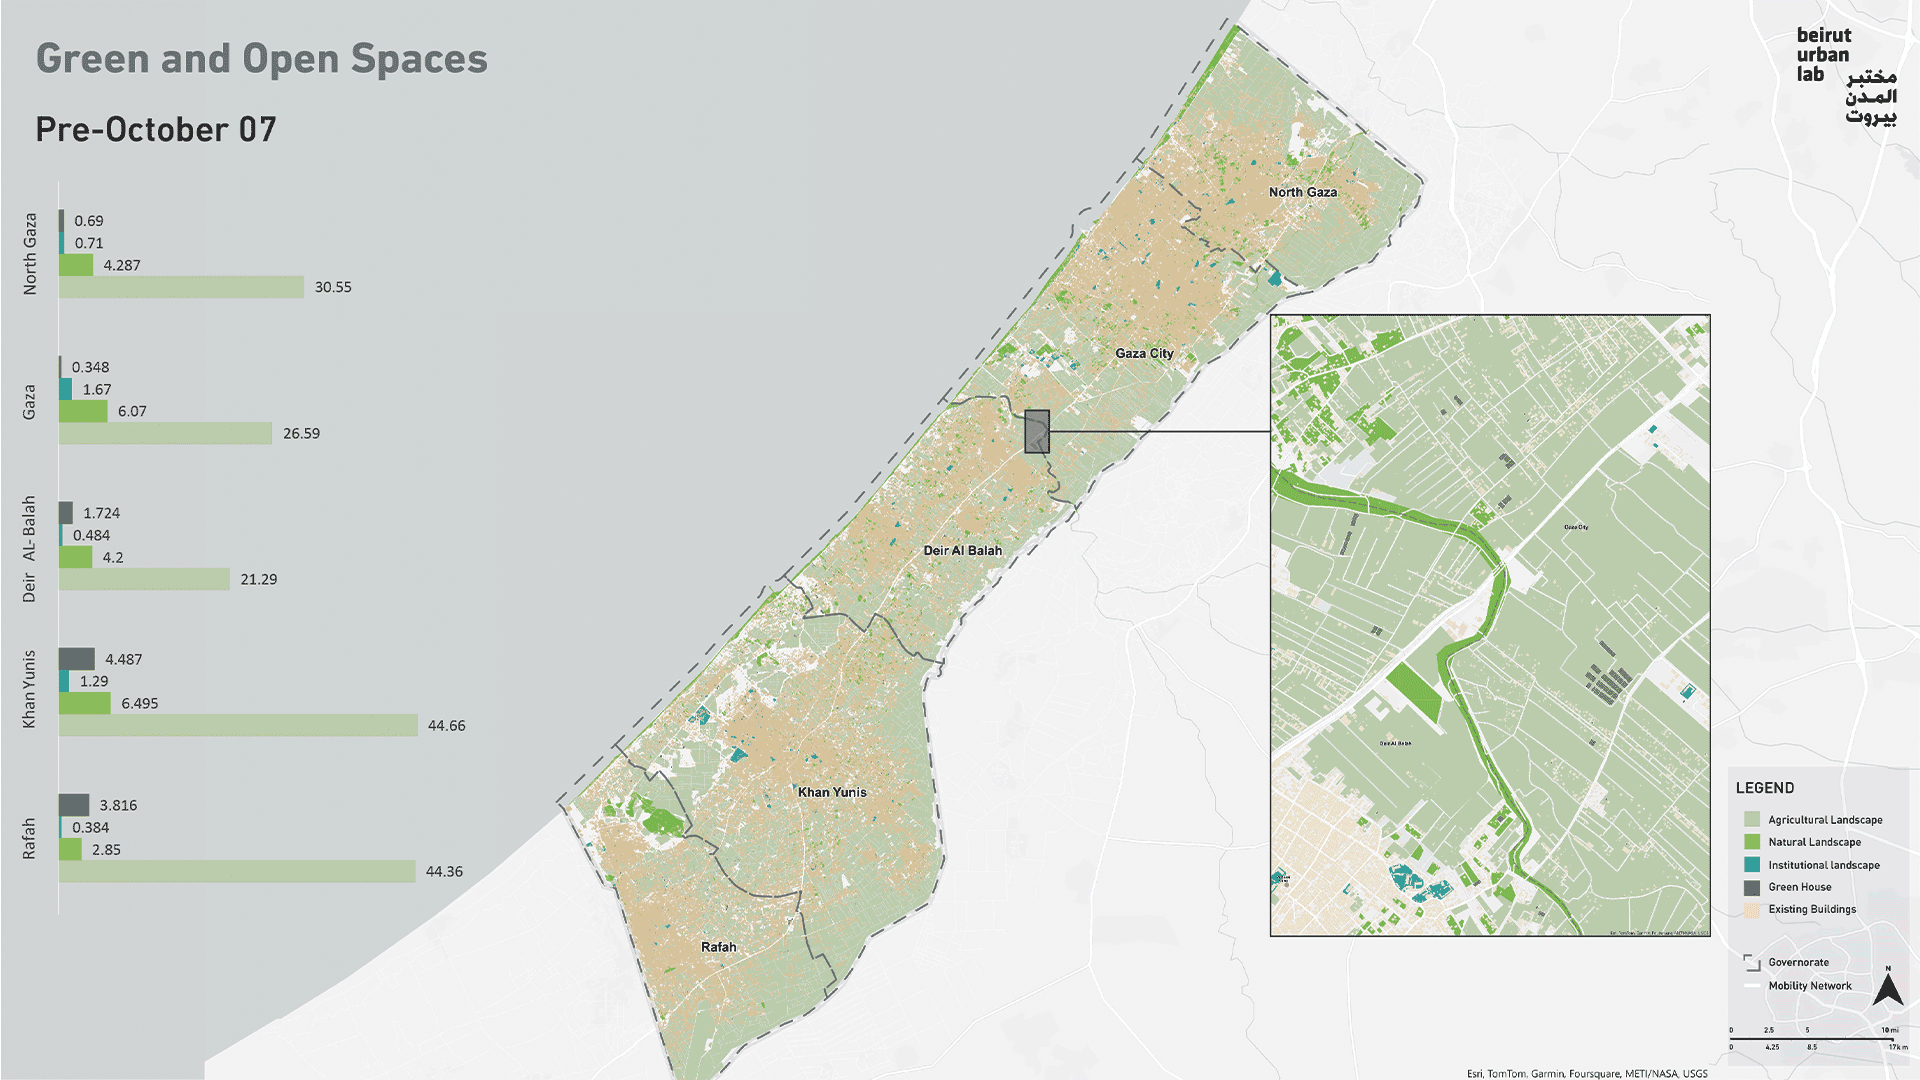
The second contribution of this project was adding a whole layer of green and open spaces to the base map and tracking of damage that followed. This layer was not found in any of the existing released assessments and maps for Gaza. The layer was created by analyzing satellite images and identifying patterns of landscapes that were categorized into natural landscapes, institutional landscapes, and agricultural landscapes. The natural landscapes include: 1) riparian: area that constitutes the interface between a river/stream and land, 2) coastal: land adjoining the sea, 3) scrubland: land consisting of scattered vegetation, usually including a selection of shrubs and wild species. The institutional landscapes include: 1) educational: open spaces around schools, universities, and other educational centers, 2) religious: open spaces around mosques and churches, mostly used for gathering, 3) recreational: parks, community spaces, cornice, and playgrounds, 4) health: open spaces around hospitals, mostly open plaza and parking spaces, 5) governmental: open spaces around governmental buildings, mostly vacant, 6) cemeteries: large burial spaces with tombs scattered in an irregular manner. Agricultural landscapes constitute the gridded arable spaces as identified from the satellite images. Green houses were also drawn unit per unit relying on the available satellite images.
The third unique contribution was showing the damage on the building footprint scale in relation to other representations of damage in Gaza. This was done by overlaying the damage data sets with our updated building and open spaces footprints. The main data source used for tracking damage to the built fabric was the georeferenced data base of damage of UNOSAT, which was provided for the following dates: 15 October, 7 November, 26 November, and 7 January. The same data source for the open/green spaces was used but was provided for the following dates: 27 October, 11 November, 11 December, 30 January, and 29 February.
As data was collected across different sources, validated, and cross referenced, several challenges emerged including discrepancies and gaps in data sources and security measures that hinder the access to satellite images. The team therefore continues to address and resolve these challenges while remaining as truthful as possible to the verified data sources given the remote nature of the team’s work and the absence of field work.
Tracking the urbicide will continue. The next issue will report damages to infrastructural facilities. However, the tracking will remain challenging and incomplete. Material remains fragmented and narratives missing. The involvement of people in Gaza and their participation in building such an archive is critical for the next phases to come and for the recovery to be imagined.
References
i Martin Coward Urbicide: The Politics of Urban Destruction (2009)
ii Source: https://www.pcbs.gov.ps/site/lang__en/1405/Default.aspx/
iii Source: https://www.unocha.org/occupied-palestinian-territory#:~:text=A%20US%241.2%20billion%20Flash,and%20through%2031%20December%202023
iv A total of 2,852 buildings were destroyed or severely damaged in Gaza during the Operation Cast Lead campaign in 2008-2009, while the number increases to 10,326 in the Protective Edge campaign of 2014. Source: UNITAR/UNOSAT (2014). 2009-2014 Density Comparison of Destroyed and Severely Damaged Structures in Gaza Strip, Occupied Palestinian Territory. www.unitar.org/unosat
A total of 450 houses (including structures with single and multiple housing units) in Gaza were totally destroyed or severely damaged during the Pillar of Defense in 2012. Source: https://www.un.org/unispal/document/auto-insert-201184/
During the Operation Guardian of the Walls in 2021, a total of 337 buildings were destroyed or severely damaged. Source: UNITAR – UNOSAT (2022). Gaza Strip Occupied Palestinian Territory Imagery Analysis.